Structural Investigation and Non-Destructive Testing NDT
Several tests may be performed during to investigate concrete condition during the construction stage (to ensure compliance to specifications) or during use for condition assessment and prediction of future performance of the structure.
Some tests are conducted in-situ while others require the collections of samples for lab testing.
Some of these tests are intrusive, while others are non-destructive.
For the project professionals (Client, Contractor and Design Professionals) to decide what tests are necessary, some understanding of purpose as well as limitations of such tests is necessary.
Following a visual inspection by an experienced consulting structural engineer that usually includes crack assessment and crack mapping and identification of any structural defects, a programme of concrete testing is needed. The most common concrete tests and techniques that are carried out in most structural investigation tasks include:
- Cover metre and rebar detection via ferroscanning to determine location, diameter and layout of reinforcement
- Rebound (Schmidt hammer)
- Chloride content tests and
- Carbonation depth.
- Half cell potential mapping.
Table 1: Types of concrete tests and techniques
|
Property under investigation |
Test |
|
Concrete strength |
Cores Near-surface tests (e.g. CAPO, Pull-Off) Rebound hammer |
|
Concrete quality |
Ultrasonic pulse velocity Petrographic examination Expansion cores Chemical analysis |
|
Corrosion of reinforcement |
Carbonation depth Cover depth Chloride content Half-cell potential and potential mapping Corrosion rate Resistivity |
|
Integrity |
Reinforcement location Concrete porosity Initial surface absorption Water absorption Water permeability Gas permeability Ground Penetration Radar GPR Thermography Gamma radiology Impact echo Acoustic emission |
Several of the tests listed on These are the most essential tests. In some cases, more information is required so it is also useful to be aware of other tests that may be conducted in more involved cases where more information is needed to support decision making.
Table 1 above will be applicable only to the most thorough inspection. The tables below show tests which are commonly or less commonly performed while analysing different types of structures.
Table 2: Concrete tests and techniques used on inland buildings and structures
|
Common |
Less common |
|
Visual inspection Crack mapping Cover metre Location of reinforcement (rebar detection) Cores and rebound Chloride content Carbonation depth |
Near-surface tests Cement content Ultrasonic pulse velocity Petrographic examination
|
Table 3: Concrete tests and techniques used on marine, offshore and highway structures
|
Common |
Less common |
|
Visual inspection Crack mapping Cover metre Location of reinforcement (rebar detection) Cores and rebound Chloride content Carbonation depth Potential mapping Resistivity Cement content |
Near-surface tests Cement content Ultrasonic pulse velocity Petrographic examination Chloride diffusion
|
Table 4: Concrete tests and techniques used on industrial structures
|
Common |
Less common |
|
Visual inspection Crack mapping Cover metre Location of reinforcement (rebar detection) Cores and rebound Dust samples and Chloride content Carbonation depth Susceptibility to noxious liquids |
Near-surface tests Ultrasonic pulse velocity Petrographic examination Potential mapping
|
Table 5: Concrete tests and techniques used on buried structures and structures in contact with ground
|
Common |
Less common |
|
Visual inspection Crack mapping Cover metre Location of reinforcement (rebar detection) Cores and rebound Dust samples Carbonation depth |
Near-surface tests Ultrasonic pulse velocity Petrographic examination Potential mapping Chloride content |
Rebound (Schmidt) Hammer Test

Why is it used?
The Rebound Hammer test is a non-destructive concrete testing method that provides a practical and quick assessment of the compressive strength of the concrete.
How is it done?
The rebound hammer, also known as the Schmidt hammer, is made from a spring-controlled mass that slides on a plunger inside a tubular chassis. The degree of rebound, which is a measure of surface hardness, is measured on a graded scale. This measured number is referred to as the Rebound Number (R rebound index or rebound value). A concrete with low strength and stiffness will absorb more energy, resulting in a lower rebound value. To take the readings, the rebound hammer is held at right angles to the surface of the concrete structure. The test can be performed horizontally on a vertical surface as well as vertically upwards or downwards on a horizontal surface.
Usually, the highest and lowest outliers are struck off from 10-12 readings and the remaining 8-10 readings are used to work out the mean for correlation with compressive strength values. Difference between the mean and any value used should not exceed 6, otherwise it is also considered an outlier. As a rule, if more than 20% of the rebound hammer values differ from the mean by more than 30%, the test series shall be discarded. It is recommended that 3 sets of readings (10-12 readings) are carried out for each test region.
Advantages and Disadvantages of using the Schmidt Hammer
The rebound hammer offers a quick and affordable method to develop an idea about the concrete condition.
The values returned by the hammer should not be depended on for design without correlation with other method to evaluate the compressive strength such as coring and destructive compressive strength, or CAPO or other methods (e.g. ultrasound velocity pulse).
Procedure Guidance
EN 12504-2 “Testing concrete in structures. Non-destructive testing. Determination of rebound number”
EN 13791 “Assessment of in-situ compressive strength in structures and precast concrete components”
Table 6: Determining Concrete Strength Class using Schmidt Hammer (Original Hammer R and Silver Hammer S) according to EN13791
|
Q (Silver Schmidt Hammer) |
fck,cylinder/ fck,cube |
R (Original Schimdt Hammer) |
||
|
Lowest for all test locations |
Median for Test Region |
Compressive Strength Class EN206 |
Lowest for all test locations |
Median for Test Region |
|
25 |
34 |
C8/10 |
26 |
30 |
|
29 |
40 |
C12/15 |
30 |
33 |
|
36 |
45 |
C16/20 |
32 |
35 |
|
42 |
49 |
C20/25 |
35 |
38 |
|
46 |
52 |
C25/30 |
37 |
40 |
|
51 |
56 |
C30/37 |
40 |
43 |
|
56 |
60 |
C35/45 |
44 |
47 |
|
59 |
62 |
C40/50 |
46 |
49 |
|
60 |
64 |
C45/55 |
48 |
51 |
|
62 |
66 |
C50/60 |
50 |
53 |
|
64 |
68 |
C55/67 |
|
|
|
66 |
71 |
C60/75 |
|
|
|
69 |
73 |
C70/85 |
|
|
|
71 |
75 |
C80/95 |
|
|
Note: Determine mean Q or R value. If > 20% of Impact values differ from median by more than 30%, discard test series.

Concrete cover and rebar detection (ferro-scanning)
Why is it used?
Ferro-scanning is used to establish concrete cover, rebar sizes and layout either to confirm information in design drawings or to support the decision when such information is missing. It can also be used when post-installed rebar is planned to avoid hitting rebar (e.g. adding anchors). Ferro-scanning is also used for compliance purposes if the project team needs to confirm that the installed rebar and cover is in accordance with the design drawings.
How is it used?
The Profoscope uses an affordable technology based on Eddy currents. More sophisticated devices based on the use of Ground Penetration Radar GPR technology or Pulse Echo technology is also available, but the Eddy current is the most commonly used.
The equipment needs to be regularly calibrated before use and on site, and the cover readings should be verified on site using intrusive inspection to reveal reinforcement at various depths, including bars at already-spalled sites and at probed locations. At spalled and drilled areas, bar diameters and the likelihood of lapped, closely spaced, or congested reinforcement should be evaluated.
Advantages and Disadvantages of using the Profoscope
The Profoscope offers an affordable and easy to use method to check concrete cover, locate rebars and identify spacing. It can be used with hand-held markers to map rebar on the surface to avoid clashes or to use in design.
The main disadvantage applies to all equipment used in rebar detection – the findings must be verified with intrusive inspection. No device used in rebar detection should be relied on completely without a degree of intrusive inspection to verify findings.
Procedure Guidance
BS 1881-204 “Recommendations on the use of electromagnetic cover-meters”

Carbonation testing (carbonation depth measurement)
Why is it used?
To establish the extent of carbonation in concrete. Carbonation is the most common cause of concrete reinforcement corrosion in above ground structures. It results from the reaction of carbon dioxide in the air and calcium hydroxide in the cement. The concrete built-in alkaline environment should prevent this reaction from advancing, but once the carbonation reaction starts, it results in calcium carbonate which reduces alkalinity so the continuous presence of moisture and carbon dioxide leads to more carbonation and more alkalinity loss. Carbonation is not considered a risk if it is still in the cover and 10mm away from rebar, but when it exceeds the concrete cover it causes corrosion in the reinforcement. Corroding rebar is six times the volume of original steel, which causes delamination of cover and spalling. Carbonation can advance at a rate of 1-5mm per year depending on exposure condition, concrete porosity, and permeability.
How is it used?
The carbonation test is performed on freshly exposed broken/drilled concrete surface. The concrete surface is immediately cleared of any dust or loose particles. The freshly exposed concrete surface prepared and is sprayed with phenolphthalein solution. The solution is an indicator of the concrete alkalinity (it turns magenta at pH > 9.2 and higher indicating alkalinity and is neutral colour when pH < 9.2 indicating carbonation). The measurements are conducted soon after the colour has stabilized. The demarcation between the region, which turns into magenta and the region showing no change in colour will indicate the carbonation front. The carbonation depth shall be measured on the exposed face. Carbonation forefront is not a clear line, but rather a zone of at most 10 mm or more in width when the pH lowers from around 13 to 8. Phenolphthalein, which is widely used to evaluate carbonation depth, changes colour about pH 9.2, but complete passivity is not achieved until the pH increases beyond around pH 11.5. As a result, there may be a zone of corrosion risk behind the apparently uncarbonated surface. The rate at which carbonation progresses is affected by the concrete quality and environmental conditions.
Advantages and Disadvantages of standard carbonation testing
The main advantage is ease of use. The drilling, cleaning and testing takes a very short time for an experienced concrete testing professional so the test is very widely used and commonly accepted as the industry standard test for measuring carbonation depth.
The only slight disadvantage is that recent research has shown that concrete starts to loss alkalinity at pH 11, rather higher than previously thought, presenting a new challenge in the industry and caution regarding assessment of carbonation.
Procedure Guidance
BS EN 14630: Products and systems for the protection and repair of concrete structures and Test Methods: Determination of carbonation depth in hardened concrete by the phenolphthalein method


Chloride content testing (chloride ion concentration)
Why is it used?
The presence chloride ions in the concrete, from saline water in coastal areas or from de-icing salts, could pose a corrosion risk. Corrosion does not occur at the reinforcement surface until a specific concentration (known as the threshold concentration) is surpassed. When a certain quantity of chloride builds up in their surroundings, reinforcing steel bars embedded in concrete de-passivate, presenting the risk of reinforcement corrosion. This is due to the chloride content of the concrete. As a result, accurate chloride analysis in hardened concrete becomes an essential parameter in evaluating current structures and predicting future service life.
The criterion for acceptable chloride concentration can range between 0.1 and 1.0% chloride by mass of cement, although the most commonly used thresholds are 0.3% (used by the Highways Agency) or 0.4%, which is found in much of the European literature. When the chloride content at the reinforcement exceeds this level, there is a high risk of corrosion, especially if moisture is present. A fairly traditional view is that below 0.4% chloride by mass of cement represents a low corrosion risk, 0.4 to 1% a medium risk and above 1% a high risk. BRE Digest 444 gives a more comprehensive interpretation of all the factors involved in chloride-induced corrosion and relates the concentration level and corrosion risk to other factors such as the half-cell potential in the concrete.
How is it done?
As it is important to determine the concentration of chloride ions at various depths in order to determine the likelihood of corrosion of the reinforcing steel, dust samples are taken from increments of depth (say 5 to 25 mm, 25 to 50 mm, 50 to 75 mm etc). The first 5 mm drillings are normally discarded as being non-representative. The sample needs to have a minimum of 25 g of dust at each depth to be representative. Care is taken to ensure all the drilling dust is collected as studies have shown that more chloride is contained in the finer component of the dust. The dust samples are then sent to the lab for chloride ion concentration calculation by mass of cement.
The chloride content must be determined by an experienced laboratory, preferably having accreditation such as UKAS (the United Kingdom Accreditation Service). It is important that the laboratory work is carried out to the appropriate national standards. This is covered by BS EN 14629, Products and systems for the protection and repair of concrete structures. Test methods. determination of chloride content in hardened concrete and BS 1881 Part 124 Testing Concrete. Methods for analysis of hardened concrete.
Advantages and Disadvantages of Chloride Content Testing
The main advantage of the testing is to scientifically prove the presence of the chloride ion concentration at different depths, thus allowing the project team to assess the risk of corrosion now and in the future.
The main disadvantage is the time it takes for the samples to be assessed. Sometimes up to two weeks. The use of rapid chloride ion testing kits solves this issue but obviously comes at associated costs.
Procedure Guidance
BS EN 14629, Products and systems for the protection and repair of concrete structures. Test methods. determination of chloride content in hardened concrete
BS 1881 Part 124 Testing Concrete. Methods for analysis of hardened concrete.


Half Cell Potential Mapping
Why is it used?
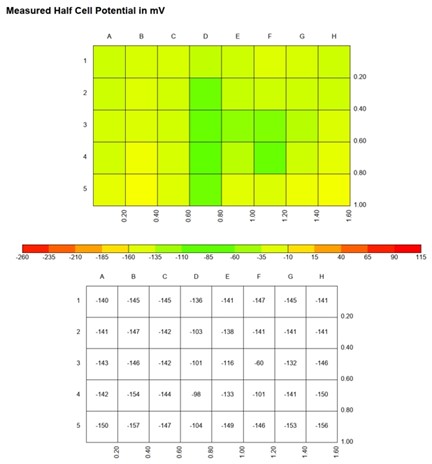
Corrosion of reinforcing bars is an electro-chemical process and the behaviour of the rebars can be characterised by measuring its “half-cell potential”. The higher the potential, the bigger the risk that corrosion is taking place. The half-cell potential mapping NDT method measures the electrochemical potential of reinforcing bars in concrete. The test involves placing a reference electrode on concrete surface and a half-cell electrode on exposed concrete reinforcing bar. The potential difference between the two electrodes provides an indication of the rebars corrosion activity. This test determines the extent of reinforced corrosion by detecting the current flow of ion migration through the concrete between anodic and cathodic sites by measuring the resultant equipotential lines. The magnitude of the measured negative half-cell potentials increases both as corrosion activity rises but also as moisture content increases. Damp areas tend to be somewhat starved of oxygen which has the effect of lowering the potential into a band normally associated with corrosion; however under this situation the corrosion rate can be negligibly slow.

How is it used?
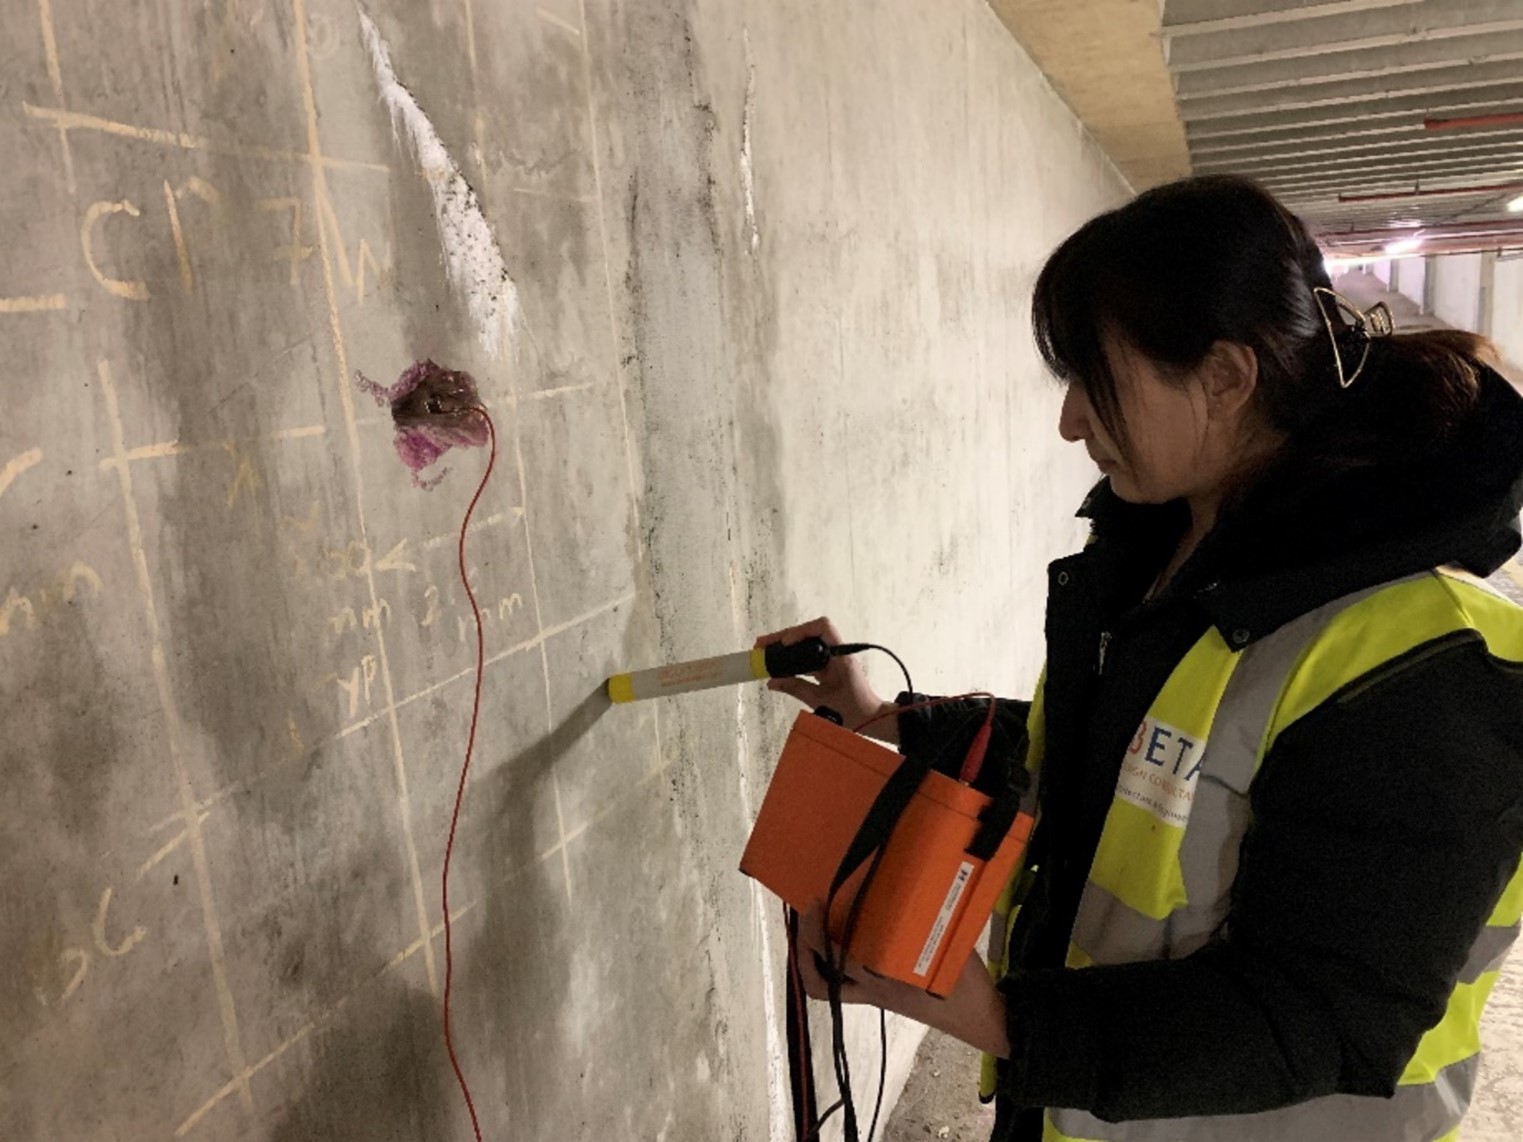
The procedure is firstly to locate and determine the rebar spacing and depth using ferro-scanning. The cover concrete is removed from one rebar and an electrical connection made for use as the reference electrode. It is necessary to check that the steel is electrically continuous by measuring the resistance between two widely separated points. The reinforcing bar is connected to the half-cell via a digital voltmeter, see diagram. Readings of half-cell potential are taken over a regular grid of points (say 200-400mm apart, depending on grid spacing and change in potential) to give a potential map of the area. Contour lines may be plotted between points of equal potential to indicate those areas that have the greatest risk of corrosion. It is important to expose and inspect the reinforcement in areas where signs of ongoing corrosion are evident as well as in normal areas. Both high and low risks of corrosion are indicated can be used to approximately calibrate the potential readings for the structure with respect to its present corrosion and the need for further investigation or repair.
Advantages and Disadvantages of Half Cell Potential Mapping
Half-cell potential mapping can be used in combination with carbonation and chloride testing to assess risk of corrosion. One disadvantage is the need to expose rebar and locally cause damage but this is seen as a minor drawback compared with the benefits and data accuracy generated by the test.
|
Measured Potential (mV CSE) |
Potential of steel corrosion activity |
|
>-200 |
Less than 10% |
|
-200 to +-350 |
Uncertain |
|
<-350mV |
More than 90% |
Procedure Guidance
Concrete Core Drilling for Compressive Strength
Why is it used?
Diamond core drilling is the used method for obtaining core samples. It employs a hollow, cylindrical bit studded with industrial-grade diamonds to cut through concrete materials. The equipment consists of a core bit, drill rig, water supply, and vacuum system.
How is it used?
The drilling location is marked and aligned accurately to ensure that the core sample is collected from the intended position. The diamond core drill is activated, and the bit is slowly lowered onto the drilling surface. The diamonds on the core bit's cutting edge grind away the material, creating a cylindrical core sample. The drilling process is continuous, and the core bit is periodically lifted to clear cuttings and allow water to flush the hole. The extracted core samples are typically sent to a laboratory for further analysis and testing.
Advantages and Disadvantages of Concrete Core Drilling
Advantages
Core drilling provides a direct measurement of the in-place compressive strength of concrete, allowing for accurate assessment of the concrete's load-bearing capacity.
When properly executed, core drilling provides representative samples of the concrete, ensuring that the test results closely reflect the strength of the entire structure.
Core drilling can be performed on various concrete structures, including slabs, columns, beams, and walls, making it applicable for a wide range of applications.
It is a valuable quality control tool during construction to verify that the concrete meets design specifications and strength requirements.
While the process involves removing a core sample, it is relatively non-destructive compared to other testing methods like destructive load testing. The surrounding concrete remains largely intact.
Disadvantages:
Core drilling involves removing a portion of the concrete, which can be aesthetically undesirable, especially for architectural concrete finishes. The process can be disruptive and noisy, and it may require temporary closures or access restrictions in the area being tested.
There is a risk of surface damage to the concrete around the drilled hole, including cracks or spalling, which can compromise the structural integrity or aesthetics.
The size and shape of the core sample can impact the test results. Smaller cores may not be fully representative of the structure's strength.
The accuracy of core testing depends on factors such as core extraction quality, curing conditions, and the quality of testing equipment. Improper drilling or handling of cores can lead to inaccurate results.
Variability in concrete properties within a structure can affect the representativeness of core samples. For example, cores taken from different locations may yield different strength values.
Core drilling can be relatively expensive, especially if multiple cores are needed from various locations. It also takes time to perform the drilling, testing, and analysis.
Core drilling generates dust and noise, which can pose health and safety risks to workers and require protective measures.
Procedure Guidance
- BS EN 12504-1:2019 - Testing concrete in structures - Cored specimens - Taking, examining and testing in compression.
- EN 13791:2007 - Assessment of in-situ compressive strength in structures and precast concrete components.
Ground Penetration Radar GPR
Why is it used?
GPR is a non-destructive geophysical method that uses radar pulses to image the subsurface of the concrete or any other material. GPR is commonly used for various applications, including inspecting and evaluating concrete structures.
How is it used?
The GPR can be used for several purposes:
Rebar Detection: GPR can locate and map the position of reinforcement bars (rebar) within a concrete structure. This is crucial for assessing the structural integrity and quality of concrete elements such as bridges, buildings, and tunnels.
Void Detection: GPR can identify voids or air gaps within concrete, which could be the result of poor compaction during construction or deterioration over time. Voids can weaken the concrete and compromise its structural integrity.
Thickness Measurement: GPR can determine the thickness of concrete elements, such as slabs or walls, without the need for destructive testing. This information is vital for assessing the remaining service life of the concrete.
Crack Detection: GPR can detect cracks or delamination within concrete structures, helping engineers identify areas that may require repair or maintenance.
Advantages and Disadvantages of using the Profoscope
The advantages of using GPR include its non-destructive capability to detect sub-surface condition, its speed and efficiency as large areas can be covered in a short time by trained operatives, its high resolution imaging that provides a wealth of information, its versatility that allows its use on different objects from different positions, and its minimum impact.
Its advantages include its high capital costs, the need for trained operatives to use and interpret the data, the challenges in interpreting data especially considering limited information depth in some cases. The depth estimation accuracy varies and requires careful calibration and the whole data interpretation can be affected by calibration, quality control and surface conditions.
Procedure Guidance
ASTM International Standard Practice for Ground Penetrating Radar (GPR) Investigation of Concrete Pavements
Ultrasound Pulse Testing UPV
Cut and Pull Out Testing CAPO
Bond / Pull-Off Testing
Creep Testing
